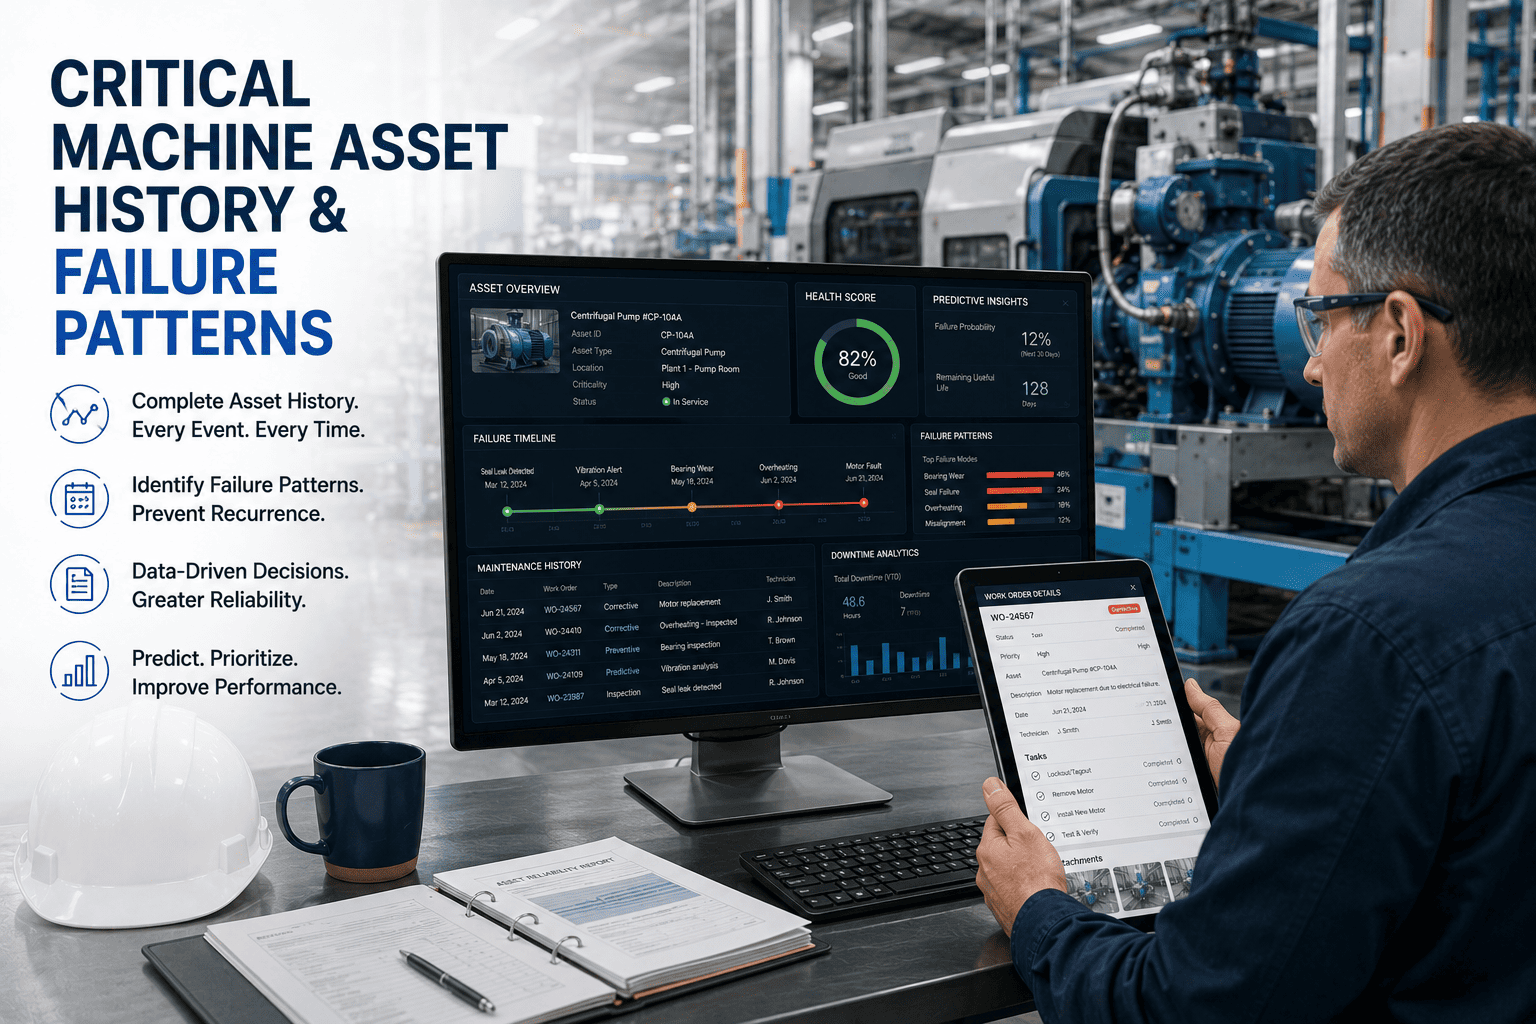
Power plant asset criticality ranking is the input that determines how every maintenance and CapEx rupee gets allocated across hundreds of assets in a single plant. Without a defensible ranking, budgets are spread evenly by category — turbines get one share, boilers another, balance-of-plant a third — and the units that genuinely carry the highest risk to availability, safety, or revenue get the same attention as units that do not. Plants moving to risk-based maintenance using ISO 31000 and API 580 frameworks reallocate 18–35% of their maintenance budget within the first cycle, and reduce forced derate hours by 40–55%. The combined cash effect on a 500 MW plant is typically USD 4M–9M annually in avoided derate plus avoided overhaul waste. Oxmaint ranks every plant asset live using Asset Management, Predictive Maintenance, CapEx Management, and Reports & Analytics — so budgeting cycles are anchored to quantified risk, not last year's spreadsheet. To see your fleet ranked, start a free trial or book a demo.
See Your Risk-Weighted Budget
See how much of your maintenance budget is going to the wrong assets — most plants find 25–40% misallocation when criticality is ranked properly.
Power Plant Budgeting Reality
Numbers Behind Risk-Based Budgeting
USD 9M
average annual savings on a 500 MW plant moving to risk-based maintenance allocation
35%
of typical plant maintenance budget reallocated in the first risk-ranked cycle
-52%
forced derate hours reduction reported by plants ranking assets on Oxmaint
5%
of assets typically cause 80% of availability risk — but only with ranked visibility
Asset criticality ranking in power generation is the structured scoring of every plant asset against three dimensions: consequence of failure (safety, environmental, production loss, regulatory), likelihood of failure (age, condition, MTBF history), and mitigation difficulty (lead time, single-point-of-failure status, redundancy). Each asset receives a composite criticality score, typically rendered on a 5x5 risk matrix, that drives PM cadence, spare-parts stocking depth, inspection scope, and CapEx prioritization.
The framework is widely codified — IEC 60812, ISO 31000, API 580 RBI, and IEEE 902 all anchor power-plant practice. What changes plant-to-plant is the data discipline behind the ranking. Oxmaint enforces a single, auditable criticality model across the entire plant and across multi-site portfolios. To map your asset register into a risk-ranked structure, start a free trial or book a demo.
The Eight-Factor Criticality Scoring Model
Oxmaint scores every plant asset against eight weighted factors. Each factor carries a 1–5 score; the composite drives the criticality rank.
F1 — Production Impact
MW Output at Risk
Net MW lost if the asset fails — directly translates to revenue loss per hour of outage.
F2 — Safety Consequence
Personnel & Public Risk
Severity of safety event if the asset fails uncontrolled — anchored to OSHA, IEC 61511, and SIL ratings.
F3 — Environmental
Emissions & Discharge Risk
Air, water, or soil contamination exposure if the asset fails — anchored to EPA and local regulator thresholds.
F4 — Regulatory
Compliance Trigger Risk
Probability that a failure triggers a regulator notification, fine, or operating-license review.
F5 — Failure Likelihood
MTBF & Condition Trend
Historic failure rate combined with current condition trend from sensors and inspections.
F6 — Lead Time
Replacement Lead Time
Weeks or months to source replacement — long-lead OEM parts dramatically lift criticality.
F7 — Redundancy
N+1 Coverage Available
Whether a backup or parallel asset exists — single-point-of-failure assets carry higher criticality.
F8 — Repair Cost
Direct Recovery Cost
Average cost to restore the asset after failure — major-overhaul-class assets carry higher ranking.
5% of plant assets cause 80% of availability risk — and only ranked visibility surfaces which 5%.
Why Calendar-Equal Budgeting Wastes Power Plant Cash
Six budgeting failures that occur when assets are funded by category or by historical pattern instead of by quantified risk.
ALLOCATION
Equal Budgets Across Unequal Risks
Same budget allocated to all auxiliary pumps regardless of which ones are running near design limit or in service for 20+ years.
PM WASTE
Overhauls on Low-Risk Assets
Costly major overhauls on assets in N+1 redundancy with low historical failure rate — budget that should go elsewhere.
UNDERSPEND
Critical Assets Underfunded
Single-point-of-failure transformers, switchgear, and main feed pumps quietly underfunded because they "didn't fail last year".
CAPEX
Replace vs Overhaul Guesswork
5-year CapEx plans built on slide-deck narrative — not on quantified residual life and failure-consequence data per asset.
SPARES
Spare Strategy Misaligned
Long-lead OEM parts not stocked for critical assets, while high-availability commodity spares overstocked across the plant.
REGULATORY
Risk-Based Inspection Gaps
API 580 RBI programs claimed but not actually data-driven — internal audits and regulator reviews expose the gap.
Each gap quietly inflates total maintenance spend while concentrating availability risk in unmonitored corners — which is why plant managers start a free trial to rank one plant section first, or book a demo for the criticality matrix walkthrough.
How Oxmaint Drives Risk-Based Plant Budgeting
Six Oxmaint capabilities combine to convert asset registers into ranked, budget-allocated, CapEx-ready risk portfolios.
A
Eight-factor scoring applied to every asset, with ISO 31000 / API 580 / IEC 60812 mappings configurable per plant type.
B
Live sensor and inspection data shift the likelihood score; assets degrade up the criticality rank as condition signals worsen.
C
PM frequency, scope, and inspection rigor automatically derived from the asset's current criticality rank — not from a static calendar.
D
Critical-rank assets drive the spare-parts depth model; long-lead OEM parts stocked where lead time multiplied by consequence is highest.
E
Rolling CapEx model built from criticality, residual life, and replacement cost — investor-grade and audit-defensible.
F
Multi-plant view of which assets, units, and sites carry the most concentrated risk — input for board-level reliability reporting.
Generation managers typically pilot criticality ranking on one unit before scaling — which is why most teams start a free trial on a high-risk unit class first, or book a demo for the portfolio heat map.
Risk-based maintenance recovers USD 4M–9M annually on a typical 500 MW plant by ending overhaul waste alone.
Calendar-Equal Budgeting vs. Oxmaint Risk-Ranked Budgeting
How a power plant operating budget behaves under each model across the dimensions VPs of Operations review.
| Budgeting Dimension |
Calendar-Equal Plant |
Oxmaint Risk-Ranked Plant |
| Budget Allocation Logic |
Last year + inflation, by category |
Criticality × consequence × likelihood |
| PM Scope per Asset |
One PM template per asset class |
Scope scales with criticality rank |
| Spare Parts Depth |
Min/max by historical consumption |
Depth by risk × lead time × consequence |
| CapEx 5-Year Plan |
Narrative slide deck |
Quantified per-asset replacement timing |
| Risk Visibility |
Implicit, tribal |
5x5 matrix per asset, live |
| Forced Derate Hours |
Trending upward |
Reduced 40–55% within 12 months |
| RBI / API 580 Compliance |
Claimed, not data-backed |
Data-driven, audit-defensible |
| Annual Maintenance Spend |
Inflates 5–8% YoY |
Flat or declining with risk targeting |
ROI & Budgeting Outcomes from Oxmaint Criticality Ranking
Measurable outcomes power plants achieve within 12–18 months of deploying risk-based criticality on Oxmaint.
USD 9M
annual savings
Typical 500 MW plant first-year run-rate savings
-52%
forced derate hours
Reduction within first 12 months on risk-ranked PM
35%
budget reallocated
From low-risk PM into high-risk asset coverage
+6 pts
availability lift
Net plant availability factor improvement
-28%
spares carrying cost
From risk-stratified stocking depth optimization
120 days
typical payback
On a single-plant criticality rollout
These outcomes form the business case generation managers carry to the board for multi-plant rollout — which is why teams start a free trial on a single plant first, or book a demo to see the multi-site heat map.
Asset Criticality & Budgeting FAQ
Which criticality frameworks does Oxmaint support out of the box
Oxmaint ships with pre-built models for ISO 31000, IEC 60812, API 580 RBI, and IEEE 902. Scoring weights and threshold bands are fully configurable per plant type — gas-fired, coal, hydro, nuclear, or combined-cycle.
How does Oxmaint update criticality as plant conditions change
Likelihood factors update in real time from sensor data, inspection results, and work order history. Consequence factors update on plant configuration changes — adding redundancy, modifying interties, or commissioning new units automatically recalculates criticality.
Can the criticality rank drive our CapEx planning workflow
Yes. Oxmaint CapEx Management consumes the criticality rank, residual life, and replacement cost to produce a rolling 5–10 year CapEx model. The model is investor-grade and exportable for board, lender, and regulator review.
How long does criticality ranking take for a typical 500 MW plant
A complete asset criticality ranking for a 500 MW plant with 1,200–2,000 assets is typically delivered in 30–45 days using Oxmaint plant-type templates. First risk-ranked budget cycle goes into the next quarterly review.
Decision Point
Stop Funding Low-Risk PMs While High-Risk Assets Run Blind
Rank every plant asset by quantified risk and align every maintenance and CapEx rupee to that ranking with Oxmaint. Used by generation operators managing fleets from 50 MW to 10 GW.
ISO 31000 & API 580 aligned
Investor-grade CapEx output
Live in 30–45 days
No DCS replacement. Works across multi-site generation portfolios. Measurable results in the first budget cycle.