Critical Machine Asset History & Failure Patterns

Connect with Industry Experts, Share Solutions, and Grow Together!

Join Discussion Forum
critical-asset-history

Critical machine asset history is the single highest-leverage maintenance dataset most manufacturers never build. Every breakdown, repair, sensor reading, root-cause note, spare-part swap, and operator log carries a signal — and when these signals are scattered across paper logbooks, technician notebooks, Excel files, and three different ERP modules, the plant loses the one input that drives reliability gains: the ability to see what fails, how often, why, and at what cost. Plants that consolidate critical asset history into a structured CMMS reduce recurring breakdowns by 35–55% within the first 18 months and shift between USD 400K and USD 2.1M per line from reactive repair into planned work. Oxmaint builds a complete failure-history record against every critical asset using Asset Management, Predictive Maintenance, Work Order Management, and Reports & Analytics — so MTBF, MTTR, and failure-mode patterns become measurable, comparable, and actionable. To see how your assets surface inside this framework, start a free trial or book a demo for a walkthrough.

Find Your Hidden Failure Patterns
Identify which assets are draining your maintenance budget through recurring failures — most plants find 8–12% of assets cause 60% of breakdown cost.
Critical Asset Reliability Reality

The Cost of Flying Blind on Asset History

4.8X
cost of reactive emergency repair vs. the same job scheduled with full asset history
82%
of equipment failures are not age-related — they follow random or infant-mortality patterns
USD 260B
annual unplanned downtime cost across global manufacturing, much of it preventable
-47%
repeat-failure reduction on critical assets after 12 months of structured Oxmaint history

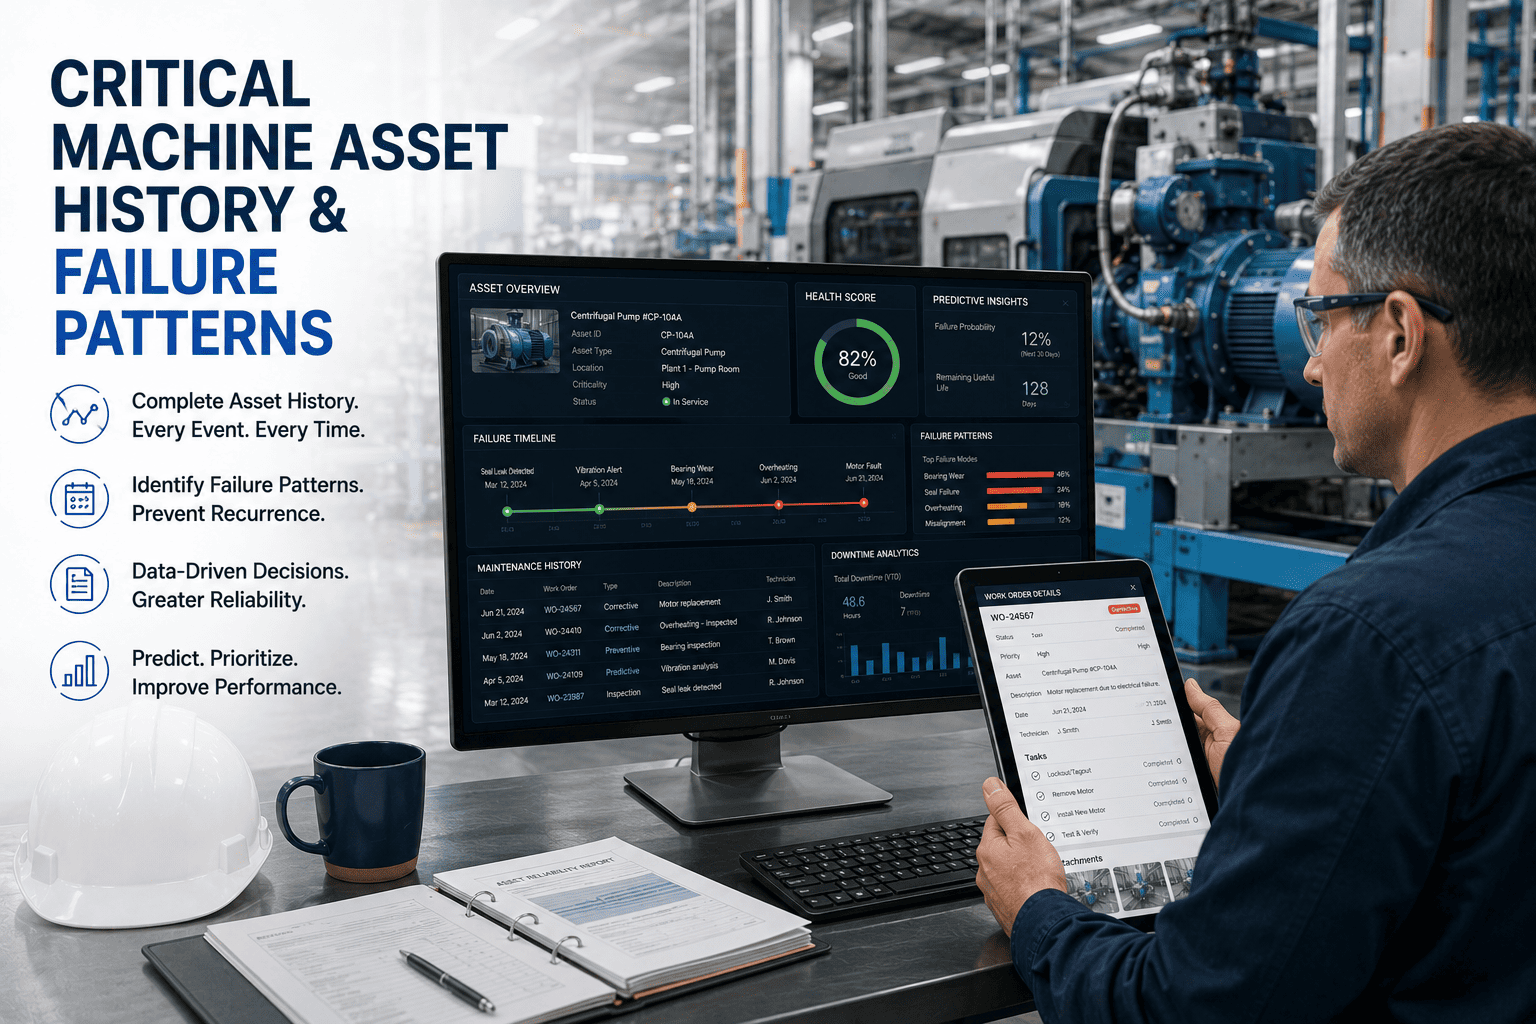
A critical machine asset history record is the complete time-ordered record of everything that has happened to a single asset — installations, calibrations, lubrications, inspections, failures, repairs, parts swaps, sensor readings, operator handovers, and cost data — linked to the specific component, work order, and technician involved. It is not a maintenance log. It is the operating biography of the machine. When the record is complete and queryable, reliability engineers can run failure-mode analysis (FMEA), pareto failure causes, calculate true MTBF and MTTR, and identify which assets justify a CapEx replacement instead of one more rebuild.

Most plants believe they have asset history. What they actually have is fragmented evidence — fields in CMMS that were never populated, paper records that never made it to the system, and ERP cost data that was never linked back to the failure event that caused it. Oxmaint consolidates all of this into a single asset record per critical machine. To see how your asset hierarchy maps in, start a free trial or book a demo.

The Eight Pillars of a Complete Asset History Record

A truly defensible asset history record contains eight categories of data, each one feeding a different reliability decision downstream.

01
Asset Identity & Hierarchy
Serial number, install date, location, parent system, component children, and replacement lineage tracked permanently.
02
Failure Event Records
Every breakdown timestamped with failure mode, root cause, downtime duration, and the work order that resolved it.
03
PM & Inspection Trail
Complete sequence of preventive maintenance, inspections, calibrations, lubrications, and condition readings.
04
Parts & Materials Used
Every spare and consumable swapped on the asset, with lot, supplier, and cost — feeding consumption forecasts.
05
Labor & Cost Capture
Hours by technician, overtime, contractor invoices, and total cost of ownership rolled up at the asset level.
06
Sensor & Condition Data
Vibration, temperature, current draw, oil analysis, and SCADA readings trended alongside intervention events.
07
Failure Mode Classification
ISO 14224-aligned coding so failure patterns can be pareto-analyzed across the entire asset class.
08
Operator Notes & Handover
Shift-handover observations, abnormal-condition flags, and operator-initiated work requests tied to the asset.
In most plants, 10% of critical assets cause 65% of total downtime cost — and history data is the only way to find them.

Why Most Plants Cannot Find Their Failure Patterns

Six recurring data and process failures that keep critical asset history fragmented, incomplete, and unusable for reliability decisions.

DATA
Failure Modes Not Coded
Work orders closed with free-text comments like "fixed bearing" — no ISO 14224 code, no pareto analysis possible later.
FRAGMENTATION
History Split Across Systems
PM records in CMMS, breakdown notes on paper, parts cost in ERP, sensor data in SCADA — no single asset view exists.
COST
Repair vs Replace Guesswork
CapEx decisions made without true cost-of-ownership history — assets that should be replaced get rebuilt one more time.
RECURRENCE
Same Failure Repeating Quietly
The same bearing, valve, or motor fails 4–6 times across 18 months — nobody connects the dots because history is fragmented.
KNOWLEDGE
Tribal Knowledge Walks Out
When a senior technician retires, decades of asset history goes with them — the new technician starts from zero.
DOWNTIME
Emergency Repair Premium
Without history-driven PM, every breakdown becomes an emergency at 4.8X the cost of the same scheduled repair.

Each of these gaps quietly inflates maintenance cost and CapEx — which is why reliability teams start a free trial to consolidate one critical asset class first, or book a demo for the failure-mode analytics dashboard.

How Oxmaint Builds Defensible Asset History

Six Oxmaint capabilities combine to convert scattered records into a single, queryable critical asset history — and from there, into reliability decisions.

A
Portfolio > Property > System > Asset > Component structure so every record always rolls up to the right level.
B
Every closed work order requires a failure-mode code, root cause, and corrective action — making pareto analysis automatic.
C
Vibration, temperature, current, and oil-analysis readings ingested and overlaid on the asset timeline with interventions.
D
Every spare consumed is tied to the asset, the failure event, and the cost — feeding true total-cost-of-ownership reporting.
E
Reliability KPIs calculated automatically per asset, per asset class, per site — pareto charts surface bad actors instantly.
F
Repair-vs-replace recommendations driven by cost-of-ownership history, remaining useful life, and failure pareto data.

Reliability and maintenance leaders typically pilot Oxmaint on their top 5–10 bad-actor assets first — which is why most teams start a free trial on a single critical asset class, or book a demo to see live MTBF and pareto outputs.

Plants that classify every failure with ISO 14224 codes reduce repeat failures by 47% in the first year alone.

Fragmented Asset History vs. Oxmaint Unified Record

The operational gap between plants without structured asset history and those running Oxmaint — measured across the data points that drive reliability decisions.

Reliability Dimension Fragmented History Plant Oxmaint Unified History
MTBF Per Critical Asset Unknown or roughly estimated Calculated live, trended monthly
MTTR Per Failure Mode Not computed Auto-calculated from work order data
Failure Mode Classification Free-text comments only ISO 14224-coded on every closure
Repeat Failure Visibility Discovered only after multiple events Flagged on the second occurrence
Cost of Ownership Per Asset Cost trapped in ERP, never linked back Full TCO per asset, year-over-year
Repair vs Replace Decision Tribal knowledge, gut feel Data-driven from history + RUL signals
Tribal Knowledge Retention Lost when technician leaves Captured in asset record permanently
Reactive vs Planned Ratio 60–70% reactive typical Inverts to 60–70% planned within 18 months

ROI & Reliability Outcomes from Oxmaint Asset History

Measurable outcomes manufacturing reliability teams achieve within 12–18 months of consolidating critical asset history into Oxmaint.

-47%
repeat failures
Reduction on critical asset class within first 12 months
+38%
MTBF improvement
Average across rotating equipment after PM cadence tuning
-32%
MTTR reduction
From history-driven repair procedures and parts staging
USD 1.4M
avg annual savings
Per mid-size plant from reactive-to-planned shift
4.8X
cost differential
Reactive vs planned, eliminated by history-driven scheduling
90 days
typical payback
On a 200-critical-asset pilot deployment

These outcomes are what reliability engineers and maintenance directors carry to VP Operations for portfolio rollouts — which is why teams start a free trial on a bad-actor asset class, or book a demo to see the analytics dashboard.

Critical Asset History FAQ

Can Oxmaint migrate our existing CMMS and paper history into the new record
Yes. Oxmaint supports bulk CSV and direct CMMS imports for asset registers, PM history, and work order archives. Paper records can be digitized in onboarding and tied to the correct asset. Most plants migrate 5+ years of history during the first 30 days.
How does Oxmaint enforce ISO 14224 failure coding
Closing a work order requires selecting a failure mode, mechanism, and root cause from the configured ISO 14224 taxonomy. The system blocks closure if any required field is empty, ensuring every record is pareto-analyzable later.
Does Oxmaint connect to our existing SCADA and condition-monitoring sensors
Yes. Oxmaint integrates with major SCADA platforms, vibration analyzers, oil-analysis labs, and IoT gateways. Readings are overlaid on the asset timeline so failure events can be visually correlated with condition trends.
How long until we see pareto failure patterns from our own data
Plants migrating 12+ months of historical work orders see pareto patterns within the first week. Plants starting fresh typically have actionable failure-mode pareto data within 90 days of structured coding.
Decision Point

Stop Repeating the Same Breakdown Every Quarter

Turn every critical machine into a full failure-history record on Oxmaint. Used by reliability teams managing 10,000+ assets across heavy industry, manufacturing, and process plants.

ISO 14224 failure coding
MTBF/MTTR analytics live
Multi-site portfolio rollup
No heavy implementation. Works across multi-site manufacturing portfolios. Measurable results in 90 days.
By Jack Edwards

Experience
Oxmaint's
Power

Take a personalized tour with our product expert to see how OXmaint can help you streamline your maintenance operations and minimize downtime.

Book a Tour

Share This Story, Choose Your Platform!

Connect all your field staff and maintenance teams in real time.

Report, track and coordinate repairs. Awesome for asset, equipment & asset repair management.

Schedule a demo or start your free trial right away.

iphone

Get Oxmaint App
Most Affordable Maintenance Management Software

Download Our App