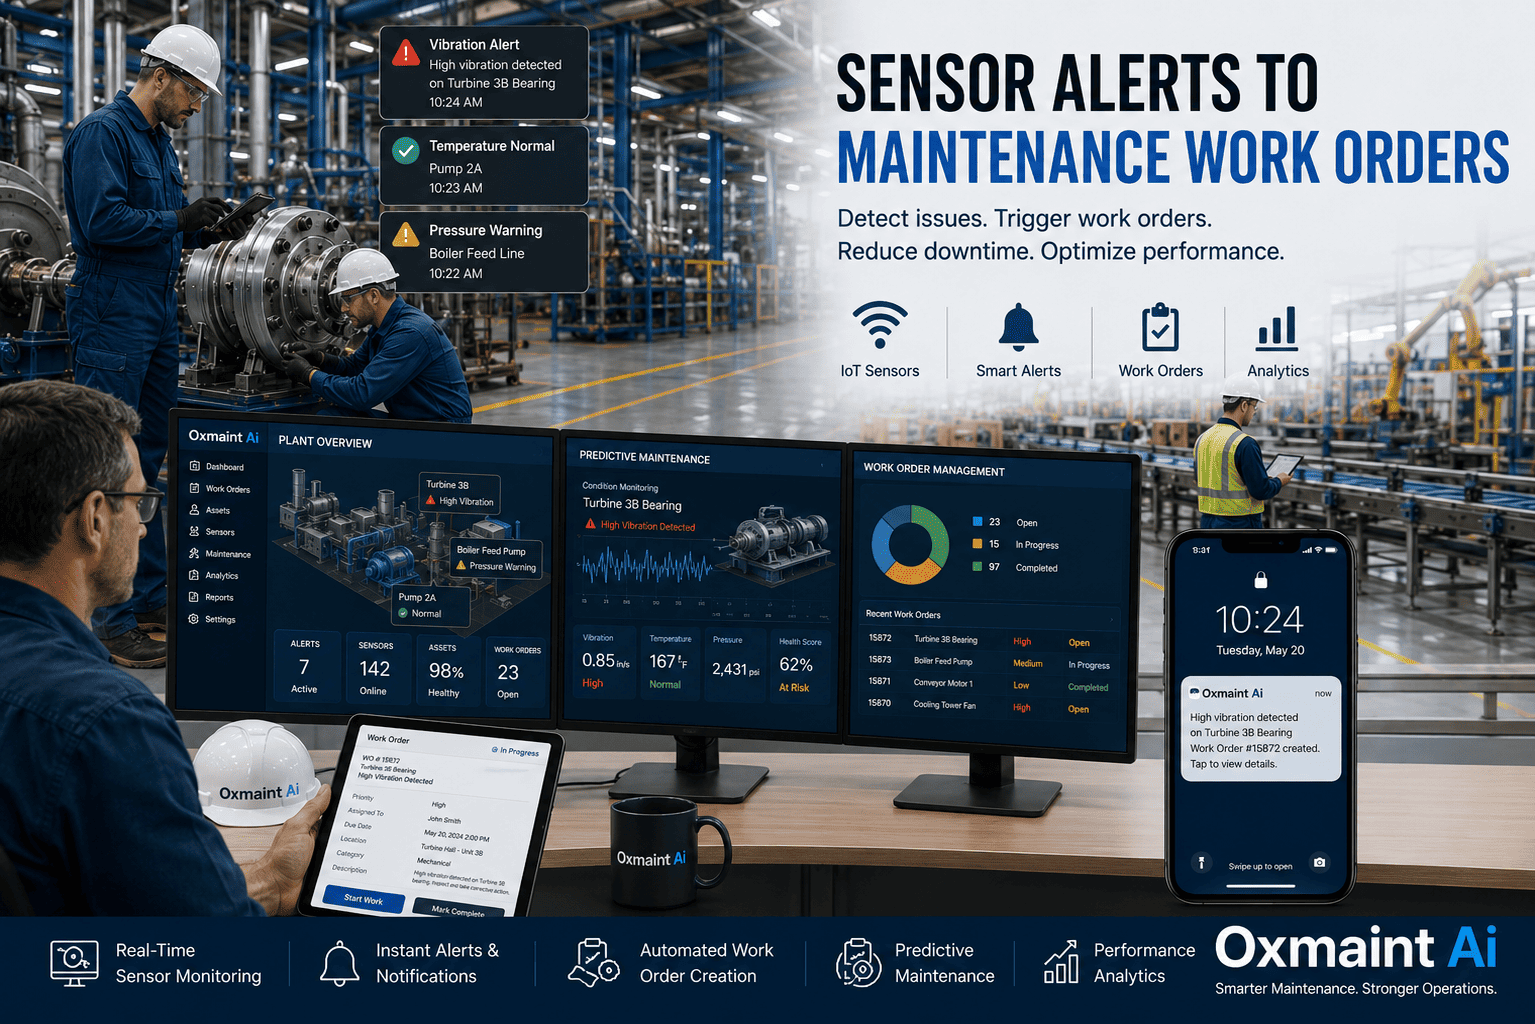
A turbine bearing vibration trend ticks above threshold at 03:14. A boiler feedwater pump motor current shows a 12% rise over 48 hours. A conveyor gearbox temperature crosses its alarm setpoint during a third-shift run with no operator on the floor. In each case, the sensor sees the failure coming — but the question every plant manager has to answer is whether that signal becomes a structured maintenance work order in time to prevent the shutdown, or whether it just becomes another alarm in a control room that nobody acted on until the failure occurred. Translating sensor alerts into work orders is not an integration problem. It is an operational architecture problem — and getting it right is the difference between a 30-minute planned intervention and a five-day forced outage costing millions in lost production, emergency parts premiums, and regulatory penalties.
See how much unplanned downtime you can eliminate by routing every actionable sensor alert into a structured work order.
Auto-generated work orders from SCADASub-30ms response on critical alertsFull audit trail for NERC and OSHA
What Happens When Sensor Alerts Stay Stuck in the Control Room
$1.7M
Typical direct loss from a single 5.8-hour forced outage at a large generation facility
69%
Of power plants experience at least one unplanned outage per month — almost all of them preceded by sensor signals
35–50%
Reduction in downtime reported by organizations running predictive maintenance with alert-driven work orders
$1M/day
Maximum NERC reliability standard non-compliance penalty — and audit trails are the first thing surveyors review
Definition
What Sensor-to-Work-Order Automation Actually Is
Sensor-to-work-order automation is the operational pipeline that takes a real-time signal from a SCADA tag, DCS point, IoT sensor, or condition monitoring device — and routes it through a defined logic layer into a structured CMMS work order with the right asset, the right priority, the right technician, and the right parts pre-staged. The goal is not to flood the maintenance queue with every alarm. It is to filter signal from noise and convert only the alerts that matter into action that gets documented.
The architecture has four layers: data ingestion from existing OT systems, anomaly scoring against learned baselines, priority assignment based on failure mode and consequence, and work order creation with auto-routing to the responsible technician. The economic case is straightforward — a single avoided major equipment failure typically exceeds the full implementation cost of the pipeline, which is why plants implementing this loop see 25–30% maintenance cost reductions and 35–50% downtime decreases inside the first 12 months. Start a free trial and connect your first SCADA feed in under 60 minutes, or see Oxmaint in action with your DCS and historian data.
Pipeline Architecture
The Six-Stage Sensor-to-Work-Order Pipeline
Every working sensor-to-work-order pipeline follows the same six stages. Skip any one, and the system either floods the maintenance queue with noise or misses the alerts that actually matter. The cards below map each stage to its operational role and the failure that occurs when the stage is missing.
01
Data Ingestion
Stream sensor tags from SCADA, DCS, historian, and IoT devices via OPC-UA, Modbus, MQTT, or REST API — no rip-and-replace of OT infrastructure required.
02
Baseline Learning
60–90 days of normal operating data establishes each asset's healthy signature — the reference all anomaly detection is measured against.
03
Anomaly Scoring
Vibration, temperature, current, pressure, and flow deviations scored against baseline with confidence ratings — replacing single-threshold alarm spam.
04
Failure Mode Mapping
Each anomaly pattern mapped to a fault type and recommended action — bearing wear triggers vibration inspection, oil contamination triggers oil sample.
05
Work Order Creation
Structured WO auto-created with asset ID, fault description, recommended action, parts list, and remaining useful life estimate — assigned to the right technician.
06
Outcome Feedback Loop
Technician closes WO with actual finding — confirmed, false positive, or escalated. Outcome data retrains the model for plant-specific accuracy.
A typical 5.8-hour forced outage costs $1.7M in direct losses — and 69% of power plants experience at least one unplanned outage per month.
Signature Pipeline
The Five-Stage Sensor-to-Work-Order Pipeline
01
Sensor Signal
Vibration, temperature, pressure, or current reading exceeds threshold from PLC, SCADA, or IIoT gateway.
02
Alert Classification
Oxmaint matches signal against rule library and historical patterns to assign severity and asset linkage.
03
Work Order Generated
Auto-generated WO with priority, failure mode, recommended procedure, and required parts list.
04
Dispatch and Execution
Technician notified on mobile with full asset history, drawings, and torque specs at the work face.
05
Closeout and Learn
Work captured, root cause logged, rule library updated — next similar alert routes faster and smarter.
Where Plants Lose Money
Industry Pain Points That Stop Alerts From Becoming Work Orders
Six failure patterns appear across nearly every power plant and factory audit. Each is a place where the sensor saw the problem and the maintenance team should have intervened — but the link between the two was missing. These are the gaps that drive the 4.8× emergency repair premium over planned work, which is why plants closing the sensor-to-WO loop typically recover 25–30% on maintenance spend inside the first year. See Oxmaint in action running this loop on real plant data.
Alarm Flooding
Single-threshold alarms generate hundreds of nuisance events per shift — operators tune them out, real alerts get lost in the noise.
SCADA-CMMS Silos
Control room sees the alert in SCADA. Maintenance sees the work order in CMMS. The link between the two depends on a phone call that may or may not happen.
No Priority Discrimination
Every alert treated the same — a critical bearing wear signal sits behind 40 lower-priority temperature drift alarms in the same maintenance queue.
No Lead Time Estimation
Sensor says "there's a problem" — but not "you have 11 days." Without remaining useful life estimates, planning gets impossible.
No Outcome Feedback
When the technician closes the WO, the actual finding never flows back to retrain the alert logic — false positives keep firing forever.
Compliance Documentation Gaps
NERC GADS, OSHA PSM, EPA emissions — every regulator wants alert-to-resolution audit trails. Manual handoffs produce gaps surveyors find.
The Closed Loop
How Oxmaint Routes Sensor Alerts into Structured Work Orders
Oxmaint connects to existing SCADA, DCS, historian, and IoT infrastructure through standard industrial protocols — OPC-UA, Modbus, MQTT, REST API — and runs a structured alert-to-WO pipeline that filters noise, prioritizes by failure consequence, and routes work to the right technician with the right context. Four core capabilities make this work at plant scale. Start a free trial and have your first asset baselined inside 30 days.
Multi-Protocol SCADA Ingestion
Siemens T3000, Emerson Ovation, ABB Symphony Plus, Honeywell Experion, GE Mark VIe, Yokogawa CENTUM — all supported via OPC-UA and standard gateways.
Anomaly Detection with RUL Estimation
Each anomaly scored against learned baseline, mapped to fault type, and assigned a remaining useful life estimate — so planners know how much time they have.
Auto-WO Creation and Routing
Structured work order auto-created with asset ID, fault description, recommended action, parts pre-staging request, and technician assignment.
NERC GADS-Ready Audit Trail
Every alert, anomaly score, work order, and resolution logged with timestamps — audit reports generated automatically for compliance reviews.
A single avoided major turbine or generator failure typically exceeds the full implementation cost of an alert-driven work order pipeline.
Before vs After
Reactive Alarms vs. Structured Sensor-to-WO Workflow
The shift from threshold-alarm reactive culture to sensor-driven planned maintenance is the single largest source of cost recovery available to power plants and factories. The table below shows how each stage of the workflow changes when the alert-to-WO pipeline is in place.
Workflow Stage
Reactive Threshold-Alarm Model
Oxmaint Sensor-to-WO Pipeline
Sensor Signal
SCADA generates threshold alarm — hundreds per shift
Sensor data continuously scored against learned baseline — only actionable anomalies flagged
Operator Response
Alarm fatigue — operator silences or ignores
Only validated anomalies surface, with severity tier and lead time estimate attached
Work Order Creation
Phone call to maintenance, manual ticket entry
WO auto-created with asset ID, fault type, RUL, parts list, technician assignment
Priority Assignment
First-come-first-served, no failure-consequence weighting
Priority assigned by failure mode and downtime cost — critical signals jump the queue
Lead Time
Hours — by the time the WO exists, failure is imminent
Days to weeks — RUL estimate allows scheduling during planned windows
Parts and Labor
Emergency procurement at 4–5× planned cost; overtime labor
Parts pre-staged from storeroom; labor scheduled on regular shift
Audit Trail
Fragmented across SCADA logs, paper WOs, and operator notes
Single timestamped record per alert — alert to resolution, NERC GADS-ready
Outcome Loop
None — same alarms keep firing forever
Technician finding feeds back into model — false positives drop quarter over quarter
Documented Results
ROI and Plant-Level Outcomes From Alert-Driven Work Orders
These results are drawn from utilities, IPPs, and manufacturing operators running structured alert-to-WO pipelines for 12 months or more — verified across coal, gas, combined-cycle, and discrete manufacturing fleets. Start a free trial to baseline your own recovery scenario.
25–30%
Maintenance cost reduction
Reported by organizations running predictive maintenance pipelines for 12+ months (GlobalData)
35–50%
Unplanned downtime decrease
Driven by lead-time on alerts that allows scheduling repairs into planned outage windows
20–40%
Equipment life extension
From condition-based intervention replacing calendar-based over-servicing or under-servicing
$60M
Annual savings on record
Reported by a large US utility running 400+ AI models across 67 generation units
95%
Adopters report positive ROI
With 27% achieving full amortization inside the first year of structured deployment
6–18 mo
Typical ROI timeline
From initial pipeline deployment to documented payback against implementation cost
Common Questions
Sensor-to-Work-Order Automation FAQ
Does Oxmaint require new sensors, or can it work with existing SCADA and DCS?
Oxmaint connects to existing SCADA, DCS, historian, and IoT infrastructure via standard industrial protocols including OPC-UA, Modbus, DNP3, and MQTT — no replacement of control systems required. Most plants achieve initial integration in 4–8 weeks using existing hardware. Wireless IoT sensors at $100–$500 per monitoring point can fill data gaps where instrumentation is missing.
How long before alert accuracy becomes reliable?
The first 60–90 days establish each asset's baseline operating signature. Reliable anomaly detection typically activates at day 90, and accuracy continues improving for 12–18 months as the outcome feedback loop refines the model against actual plant findings.
What protocols and DCS platforms does Oxmaint support?
All major industrial protocols (OPC-UA, Modbus TCP/RTU, DNP3, MQTT, REST API) and all major DCS platforms used in power generation and manufacturing — Siemens T3000 and SPPA-T3000, Emerson Ovation, ABB Symphony Plus, Honeywell Experion PKS, GE Mark VIe turbine controls, and Yokogawa CENTUM VP.
What is a realistic first-year savings number for a 400–600 MW plant?
Plants in that capacity range typically report $1.1M to $1.9M in Year 1 documented savings from a structured sensor-to-WO pipeline. The primary driver is failure prevention — a single avoided major turbine or generator event usually exceeds the full implementation cost. Maintenance labor savings and audit prep recovery add 30–40% on top.
Stop Losing Millions to Reactive Failures
Turn Every Actionable Sensor Alert Into a Scheduled Work Order
Power plants and factories running structured alert-to-WO pipelines through Oxmaint cut unplanned downtime by 35–50%, recover 25–30% on maintenance spend, and walk into NERC and OSHA audits with full timestamped audit trails. Used by operations teams managing 10,000+ assets. See measurable results in the first 30 days.
SCADA, DCS, historian, and IoT ingestion in 4–8 weeks
Auto-WO creation with RUL estimate and parts pre-staging